UPenn and Columbia Endowments Take the Lead In 2023 Fiscal Year
Endowments and pensions continue to post gains, but exposure to private markets pushes many below benchmarks
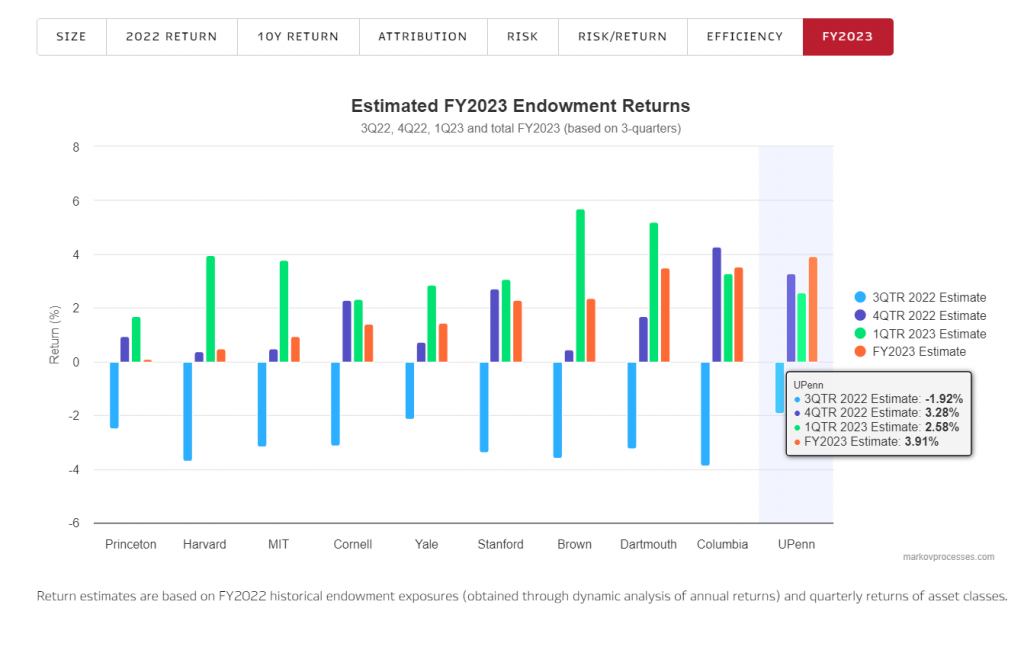
Three quarters into the 2023 fiscal year, MPI Transparency Lab estimates that University of Pennsylvania is leading the pack with 3.91%, with Columbia University close second with 3.55% estimated return. Princeton University and Harvard University are expected to trail other Ivy League universities with returns close to zero.
As equities rebounded in the fourth quarter of 2022 and the first quarter of 2023, endowments with the most exposure to global public equities (UPenn and Columbia) and technology sector in particular (Brown University and Dartmouth University), most likely saw their returns lifted up after losses in the third quarter of 2022.
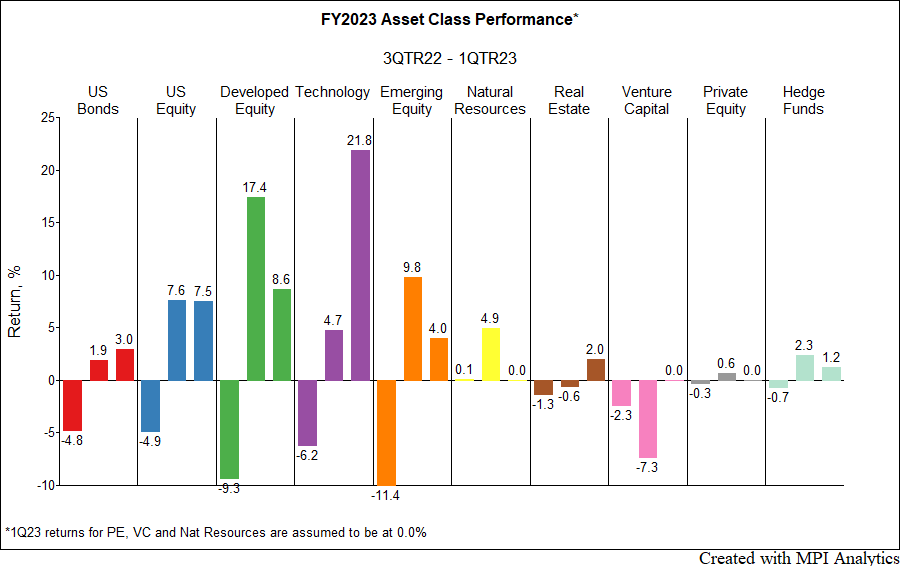
We compiled our projections for fourth quarter of 2022 based on the recently released Cambridge Associates’ Private Benchmarks preliminary estimates. The CA Venture Capital index was down -7.31% for the fourth quarter (67% reporting) and CA Private Equity Index is up 0.62% (63% of funds reporting). CA Real Estate index return is -0.56% for the quarter, with 60% of funds reporting. Even though we’re a couple of months away to get preliminary estimates on private benchmarks’ returns for the first quarter of 2023, we don’t expect any breakthroughs for private equity and venture capital given rising interest rates, depressed valuations, and the increased bankruptcy rates in early 2023. Therefore, for our estimates we conservatively assumed fourth quarter returns for PE and VC at zero and expect the gap between the best and the worst Ivies widen as we start getting private benchmark estimates.[1]
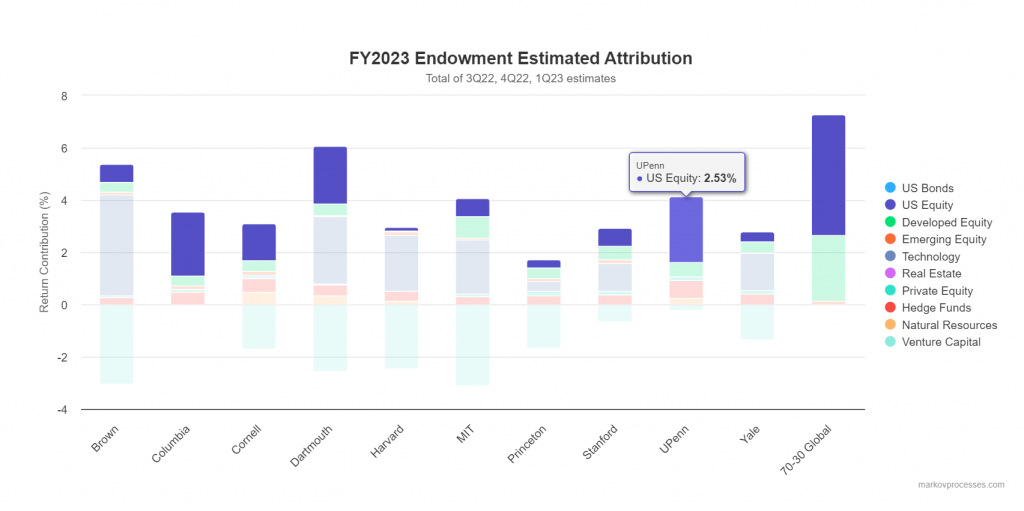
Below we show the impact of individual asset class exposures on estimated FY2023 returns. Endowments with the highest exposure to U.S. equities and, especially, technology stocks had their returns lifted, while venture capital was the only asset class which negatively impacted the estimated outcomes so far. Endowments with the highest exposure to VC are going through challenging times…
Pensions
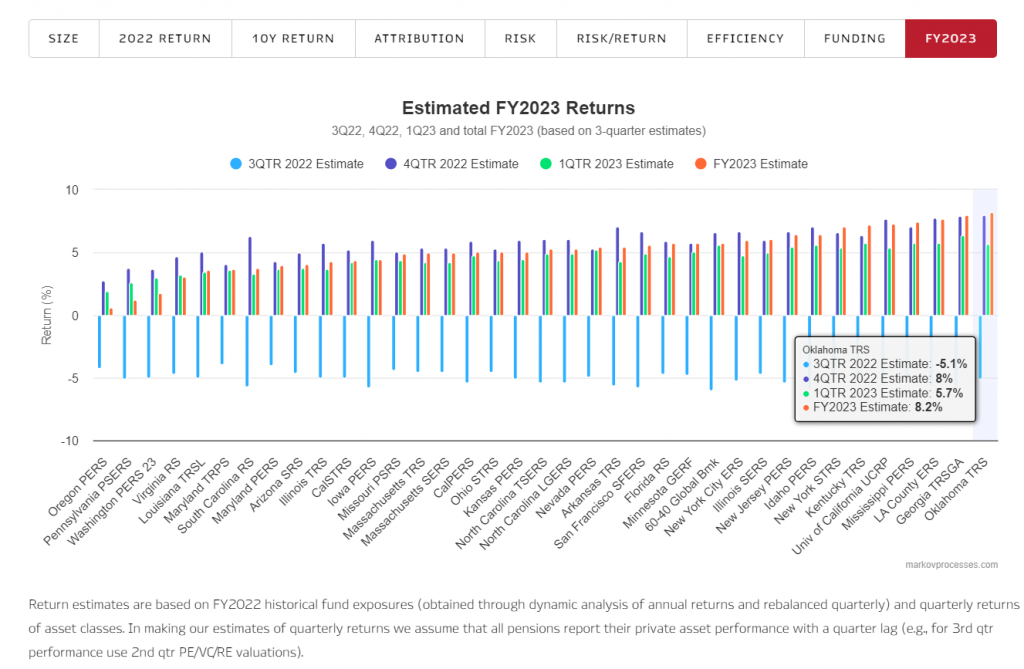
MPI Transparency Lab estimates that large U.S. public pensions[2] have median return of 5.2% for the three quarters of the 2023 fiscal year ending in June. We estimate that Oklahoma TRS has the highest return of 8.2%, with Georgia TRSGA being close second. Performance of the Global 60-40 benchmark[3] for the three quarters of FY2023 was 5.8%, with a -6% loss in the third quarter, 6.6% gain in the fourth quarter of 2022, and a 5.6% gain in the first quarter of 2023 – quite a swing, which is also indicative for most of the pensions’ performance experience. However, given the differences in pensions’ asset allocations both the magnitude of the swing and the end-result vary, of course.
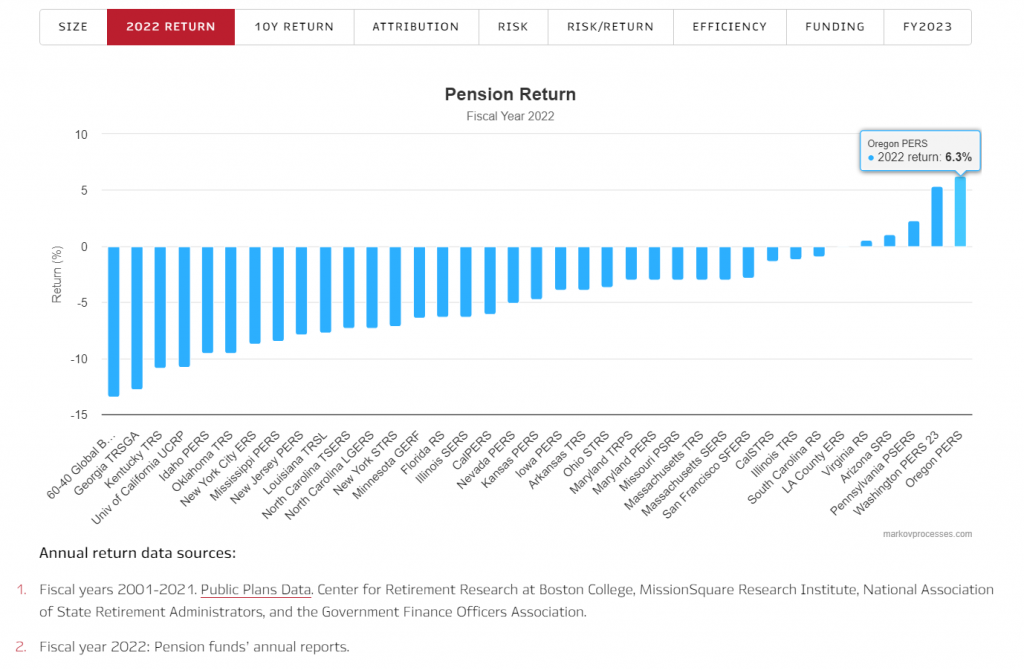
Take, for example, the lowest FY2023 estimated performers in the group – state employees’ pensions of Oregon (0.6% estimated return), Pennsylvania (1.2%) and Washington (1.8%). Interestingly, last fiscal year these three pensions reported the highest performance in the group as shown in chart below. Thus, Oregon PERS reported a 6.3% gain in FY2022 while most peers lost more than 5% and some lost even more than 10% over the same period.
What makes this group of three pensions unique is their outsized allocations to private assets. When pensions report their results, they usually use previous quarter valuations for their private assets: e.g., first quarter private valuations for the June fiscal year annual report. In FY2022, that was enough to propel these three funds to the top: Cambridge Associates Private Equity index performance for the first quarter of 2022 was -0.35%, while the second-quarter return of the S&P 500 Index was -16.1%, which caused the three pensions above with lower exposure to public equities to outperform.
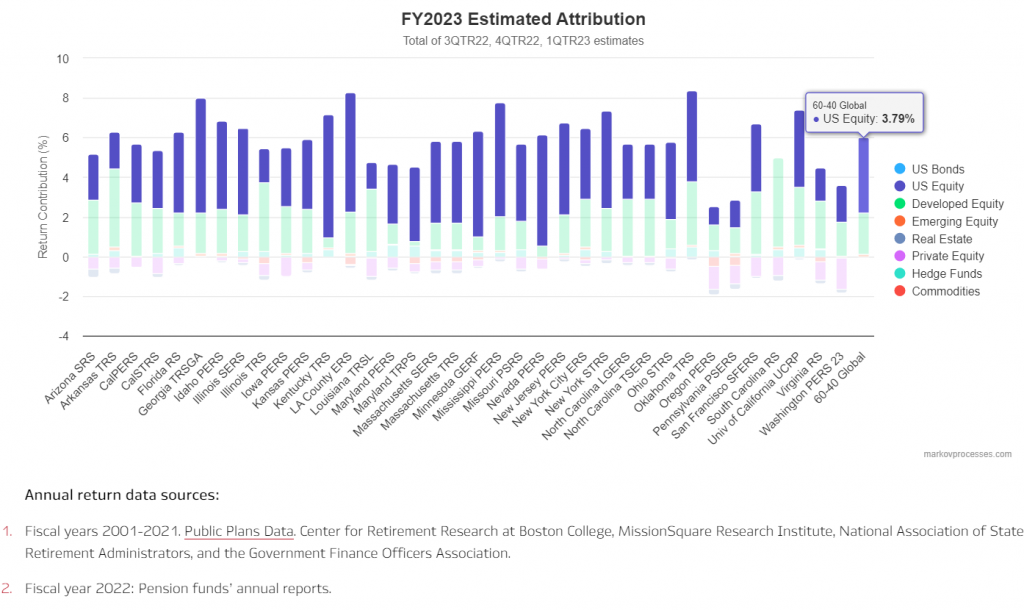
In the attribution chart below, we show the contribution of asset classes to the total estimated return for the three quarters of FY2023. Global equities are the major driver so far of the FY2023 pension performance.
Private equity was by far the major detractor as pensions heavy into private equity absorbed the 2nd quarter 2022 5% loss for private equity (which was not counted in the last fiscal year number due to lagged reporting).
Knowing how an endowment or pension is doing quarter by quarter not only serves to satisfy one’s curiosity. Rather it prepares beneficiaries so that they are not caught by surprise at the year-end by the results. However, we see the main value of this feature in providing pension CIOs valuable datapoints about their narrow set of close peers.
Please visit MPI Transparency Lab for more details.
[1] We also assumed zero return for Natural Resources as the Preqin benchmark return wasn’t available for the 1st quarter. Given relatively low exposure of endowments to this asset class we don’t expect significant changes to estimated endowment returns for the quarter.
[2] We provide detailed information on 36 public pensions with assets over $20B and June fiscal year reporting.
[3] Quarterly rebalanced 60% MSCI AC World Index and 40% Bloomberg Barclays Aggregate Bond Index
