CIO’s Winning Strategy: Strive to Be Average
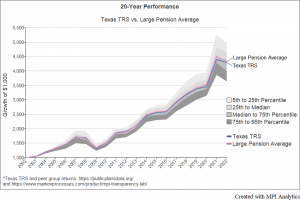
For the past 20 years Texas Teachers Retirement System’s performance mimics the average of large public pensions tracked by MPI Transparency Lab.
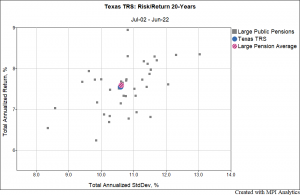
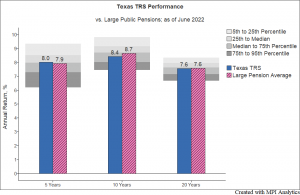
Texas Teachers’ (TRS) pension fund is recognized to be one of the most sophisticated investors in the nation. Its investment team garnered more accolades, press mentions and recognition awards than all other pensions combined. However, a comprehensive quantitative report on the pension recently released by the MPI Transparency Lab and available for free download indicates that its performance track record is nearly indistinguishable from the average of the largest U.S. state pension systems tracked by MPI’s Lab. The performance charts below illustrate significant dispersion in performance and risk among this group of about 40 large pension funds, with Texas TRS consistently in the middle of the pack: 7.6% 20-year annualized return and 10.6% 20-year annualized standard deviation of published annual returns.
Why Pension Peer-Average is An Important Benchmark
There were attempts among academia and practitioners to benchmark a generic pension performance, especially when it comes to value add (or not) in relation to alternatives.[1] We should note here that pensions’ investment teams operate within a multitude of allocation constraints: regulatory, political, actuarial, spending, and budgeting ones that cannot be captured in a simple regression model. Most importantly, large pensions in particular cannot rebalance at will or on a schedule (annually) like static regressions mandate, especially when it comes to private investments: in fiscal year 2021 some pensions’ private equity (PE) investments had 50-60% growth which led to significant increase of their PE exposures. As a result, some pensions’ PE allocations grew to almost twice their target[2] and these cannot be rebalanced contractually without incurring significant losses. However, a static regression model mandates that these allocations are “rebalanced” back to the same average exposures annually and without any incurred costs. Besides, regression models are sensitive to serial correlation of returns[3] which could lead to significant biases in alpha estimations[4].
Therefore, an average return of pensions that have similar size and similar mandates and operate within similar constraints (public pensions, for example) provides a more relevant yardstick than any academic abstraction such as 60-40 equity/fixed income or a static regression model given its imperfections and sensitivities.
So far computations of public pensions’ peer averages and their analysis was a prerogative of institutional consultants and custodians which have access to clients’ portfolio holdings. However, a significant drawback of peer comparisons using holdings information lies in inability to compare and attribute individual asset class allocations across pensions because of differences in their asset class designation nomenclature.[5] MPI Transparency Lab was launched with the goal of overcoming this issue by providing common denominator for both individual and peer-benchmark comparisons of pensions and endowments.[6]
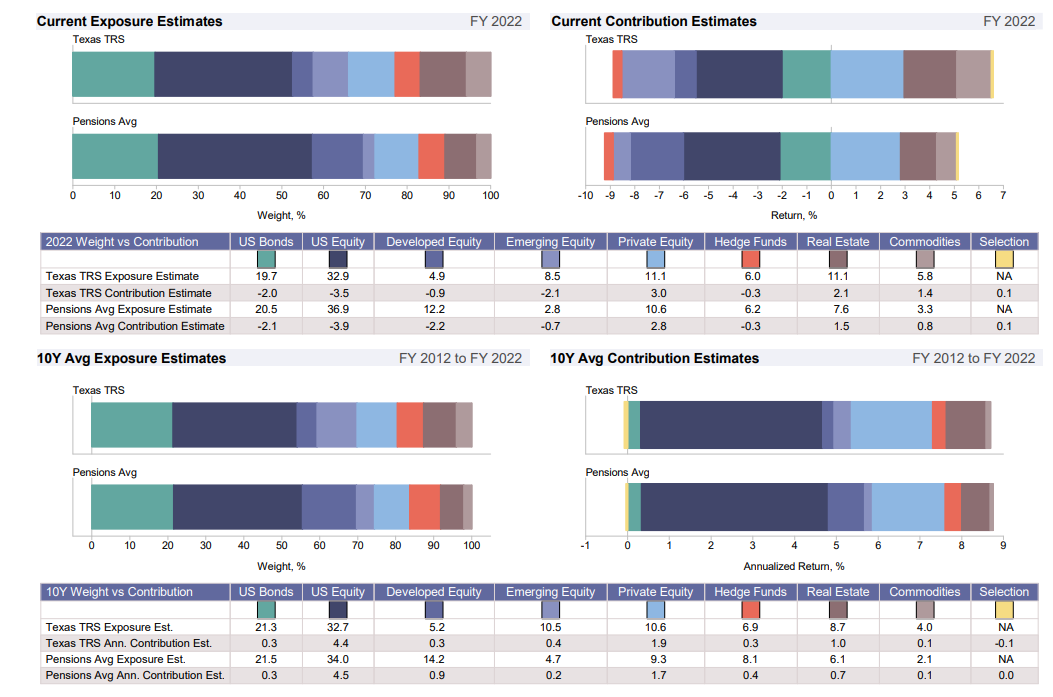
A snippet below from MPI’s Transparency Lab report for Texas TRS indicates that the pension portfolio’s factor exposures and contributions are similar to the peer-group average with the most contribution to 10-year annualized return as of 2022 fiscal year is coming from US Equity exposures (4.4% for the Texas TRS, 4.5% for the peer average) followed by private equity exposure (1.9% and 1.7% respectively).
These results, which are derived through MPI’s proprietary Dynamic Style Analysis (“DSA”) do not utilize actual holdings.
What About the Alpha?
One might wonder how such a star-studded team ended up with consistently average performance versus its peers over the past 20 years. The apparent answer is that asset allocation is still the dominant determinant of portfolio performance. One needs to have a strong but open-minded investment committee that can resist both internal and external (consultants!) pressures taking a moderate position on various industry fads such as clean energy or private equity, while at the same time not being super-conservative and open to new trends. And that’s exactly how Texas TRS views itself. The ultimate reward – average performance!
How about the alpha generated by each team and touted both in press and in Texas TRS’s annual reports? This is where we see again the miracle of diversification, the “invisible hand” of financial markets. Diversification comes in various flavors: First, within individual funds where idiosyncratic risks of individual securities offset to distill out dynamic sector/style exposures that our clients capture with MPI’s due diligence and risk tools; and, second, at the macro multi-manager level where the alpha of individual investment teams and dozens of investments offset to deliver index-like performance.
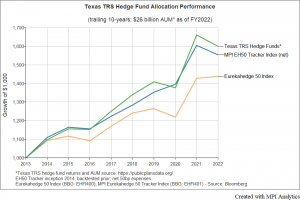
This dynamic is best seen represented by alternative investments, where the power of diversification is the strongest[7]. In the chart below, we compare 10-year cumulative performance of the pension’s hedge fund allocation[8] with two benchmarks: a non-investible Eurekahedge 50 Index and its investible tracker MPI Eurekahedge 50 Tracker Index[9] (EH50 Tracker).
The Texas TRS hedge fund portfolio is well diversified and is index-like, having 95% correlation with both Eurekahedge 50 and the EH50 Tracker. However, it exhibits 1% annual alpha vs. the hedge fund index and almost no alpha vs. the liquid EH50 Tracker. One possible explanation is that, due to its size and negotiation power, the pension fund can save on both management and performance fees. This results in significant savings compared with the Eurekahedge 50 Index, which is reported net of average fees of 1.5/20.
The EH50 Tracker index aims to mimic hedge fund performance before fees, and its track record serves as evidence that fee savings could contribute to a 1% annual outperformance compared with a hedge fund index. Nonetheless, the fact that a large alternative allocation demonstrates index-like performance suggests that its exposures could counterbalance allocations of global equity, fixed income, and commodity teams.
So, if investment teams a) diversify across strategies, and b) don’t make a lot of mistakes simultaneously, the resulting performance of each will be ultimately index-like (whether they want it or not), while alpha, if any, will cancel out across the teams. In many cases, what is perceived as alpha may, in fact, simply be a hidden factor or asset class exposure – one just has to look deeper.
How Bad Is It to Be Average?
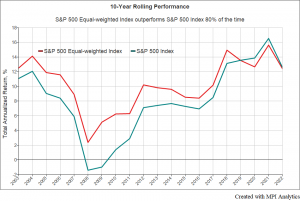
We wrote on these pages that average performance is a blessing rather than a curse.[10] By definition, the average pension portfolio outperforms roughly half of its peers – “guaranteed” – a feat that is hard to achieve by any other means, even if one wanted to. The phenomenal consistency of average performance comes from the math behind it. It is really hard to outperform an equal-weighted index over the long-term. For example, on a 10-year rolling basis, an equal-weighted S&P 500 Index outperforms its market-weighted version 80% of the time over the past 20 years (tied in two 10-year periods and outperforms in 16 out of 20 10-year periods). We illustrate this phenomenon in the chart below.
Many investment products have emerged, often raising billions of dollars, that are based on exceptional back-tested performance. However, in reality, it’s their close-to-equal-weight nature that drives their investment returns. The exceptional results of both MPI’s hedge fund trackers stem from their ability to track equal-weighted averages of select funds.
As an additional benefit, average performance also shields pension CIOs from headline risk and criticism from the board. It’s worth remembering that financial markets don’t reward ego and arrogance in the long term. That is John Bogle’s legacy.
Large Pension is an Index Fund
And with that we compliment Texas TRS on their remarkable results, whether they intended it or not. We found no other pensions in the group having similar long-term performance consistency[11] with a lower risk. But for what essentially running an index portfolio the $184 billion pension paid hefty fees in 2022 fiscal year: $2.2 billion, with roughly half coming from hedge funds and private equity.[12]
How could one do the same with limited resources and replicate the average pension with a one-man team and on a low budget? Obviously, just using the published average asset allocations of pensions won’t work because, in our view, it’s the factor exposures that ultimately drive performance – not published allocations. Traders figured that out a long time ago and they came to avoid using sector allocations to hedge portfolio risks. Instead, they prefer what are called “beta-adjusted exposures,” which account for the relative risks of individual positions (not all tech stocks are the same!). To calculate such exposures from returns we use our returns-based analytics, recognizing that exposures are time-varying and need to be cross-validated. Index implementation of each asset sleeve is possible, even with alts, as we’ve demonstrated with our hedge fund trackers. Private investments could be perceived as a challenge. However, with the right quant modeling, PE alpha can often be quantified as a product of sector bets, leverage and delayed reporting[13].
_______________________
[1] Ennis, R., Have Alternative Investments Helped or Hurt? (August 3, 2023). Available at SSRN: https://ssrn.com/abstract=4531038
[2] $4 billion Houston MEPS allocation to PE was 31.4% per FY2022 annual report 2022-acfr—investments-section.pdf (hmeps.org) – mostly due to 64.6% return of their PE portfolio in FY2021. MEPS PE target allocation is 17%.
[3]Returns of alternative strategies, private investments in particular (private equity, private debt, real estate, real assets, etc.) are significantly autocorrelated. See for example, Korteweg, Arthur G., “Risk and Return in Private Equity” (August 3, 2022). Handbook of the Economics of Corporate Finance, Vol 1: Private Equity and Entrepreneurial Finance, Forthcoming , Available at SSRN: https://ssrn.com/abstract=4170135.
[4] See for example, Getmansky, M., Lo, A., Makarov, I., “An econometric model of serial correlation and illiquidity in hedge fund returns,” Journal of Financial Economics, 2004, vol. 74, issue 3, 529-609
[5] Asset class benchmarks for traditional assets such as equities and fixed income differ between pensions. However, when it comes to alternatives, the differences are even more pronounced. Texas TRS has three separate designations and benchmarks for alternatives (hedge funds).
[6] Please visit MPI Transparency Lab | Our Approach for more information
[7] Offsetting long and short bets of hedge funds cancel out and decrease volatility at a higher rate (per number of funds in a portfolio) than long-only funds.
[8] Both return data and AUM are from https://publicplansdata.org Public Plans Data (PPD) affiliated with Boston College. Per pension annual reports, Texas Teachers’ hedge fund allocations are allocated to Directional hedge funds, Absolute return hedge funds, and Stable Value hedge funds.
[9] BLOOMBERG: EHFI401. The tracker consists of 25-30 liquid ETFs and is priced daily by Alerian. Net of proforma 50bp fees and ETF fees and expenses.
[10] Beleznay, A. and Markov, M. and Panchekha, A., Hidden Benefits of Equal Weighting: The Case for Hedge Fund Indices (November 28, 2010). Available at SSRN: https://ssrn.com/abstract=1716547
[11] We measure consistency of performance as the lowest (worst) rank of the rolling 10-year returns over the past 20 years. As a risk measure, we use 10-year standard deviation of quarterly returns of asset class proxies. See MPI Transparency Lab for more detail.
[12] Texas TRS 2022 Annual Report p.120 ACFR 2022 (texas.gov)
[13] Interestingly, Nevada Public Employees’ Pension (PERS) comes close to the lean pension strategy described earlier: it runs a $54 billion portfolio employing an indexing strategy for which it paid just $68 million in fees in 2022 fiscal year. According to MPI Transparency Lab, Nevada PERS has 10-year Sharpe Ratio of 0.77 – the highest of all large public pensions with assets greater than $20 billion. In contrast, Texas TRS Sharpe Ratio is only 0.68.
