Chart of the Week: Halftime Huddle – YTD Performance & the Future of Active Management
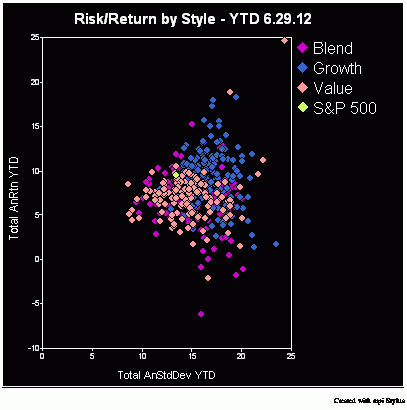
As we pass the halfway point, we thought it would be interesting to check in on the performance of the U.S. equity mutual fund universe across the various broad style categories – Growth, Value and Blend. Growth was clearly the winning category for the half year period. Through the end of Q2, the average large […]
 As we pass the halfway point, we thought it would be interesting to check in on the performance of the U.S. equity mutual fund universe across the various broad style categories – Growth, Value and Blend.1 Growth was clearly the winning category for the half year period. Through the end of Q2, the average large (AUM > $1bn) actively-managed fund2 returned 8%; the average Growth, 9.2%; Blend 7.5%; Value, 7.1%.3 These returns largely mirrored broad style indices; the Russell 1000 Growth returned 9.2% and Russell 1000 Value 7.3%.
We thought it would be compelling to throw in the S&P 500 (which returned 9.5%)4, to view year-to-date (YTD) outperformance of the industry’s favorite equity market benchmark. While pitting performance against the S&P 500 is, in general, an inaccurate and incomplete barometer of an equity fund’s worth when looked at irrespective of investment strategy and horizon, particularly over the short term, the market and media have made it a habit to use the index as a universal benchmark (though it’s style is large-cap Blend or Core).
Sign in or register to get full access to all MPI research, comment on posts and read other community member commentary.