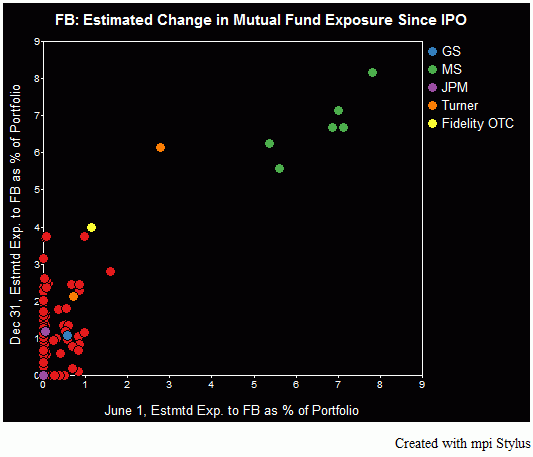
Chart of the Week: FB – Change in Estimated Mutual Fund Exposure Since IPO
As we say “goodbye” to 2012, we turn back to the year’s biggest IPO and history’s largest tech IPO, Facebook (NASDAQ: FB). The intention of the original post on FB was to see what quantitative analysis of a galaxy of mutual funds using daily data over a very short time period can actually show a […]

As we say “goodbye” to 2012, we turn back to the year’s biggest IPO and history’s largest tech IPO, Facebook (NASDAQ: FB).
The intention of the original post on FB was to see what quantitative analysis of a galaxy of mutual funds using daily data over a very short time period can actually show a savvy fund investor. The applications for such single security detection were mostly for risk management purposes, understanding exposure to a new security whose value was of much debate, as evinced by its stock price.
Sign in or register to get full access to all MPI research, comment on posts and read other community member commentary.