Bitcoin’s Unlikely Performance Doppelganger: Levered Amazon.com
Bitcoin has had a spectacular year, with its price growing by 2,000 percent, topping out at nearly $20,000 before falling to a little over a third of that value. So, we posed the question to ourselves: how might investors have achieved Bitcoin-like returns over the last two years without needing Ambien to stomach the whipsaw swings in price?
Not a day goes by without some dramatic news about cryptocurrencies, sending their prices either in a downward spiral or shooting skyward with a double digit daily gain. Bitcoin, in particular, has had a spectacular year, with its price growing by 2,000 percent, topping out at nearly $20,000 before falling to a little over a third of that value.
Last week the DOJ launched a criminal probe into Bitcoin price manipulation immediately pushing the price down closer to the $7,000 level, and no doubt unnerving Bitcoin investors. Yet, news of a major exchange in talks about adopting Bitcoin trading and VCs pouring billions of dollars into cryptocurrency firms continues at a breakneck pace.
Such wild swings of crypto-prices don’t seem to be related at all to other currencies and even less so to stocks, other than blockchain related, of course. With all the factors that are affecting cryptocurrencies’ prices—regulatory concerns, criminal investigations, rumors of hacking and fraud, and real cases of fraud and hacking—crypto-investors would seem to be in constant need of antidepressants or sedatives.
Wait, that’s an interesting idea: what if the prices of Bitcoin and drug companies are related? Unfortunately, Bitcoin has zero correlation to the stock price of Sanofi, the maker of Ambien, so there goes the idea of at least one plausible connection.
Not only that, Bitcoin has zero correlation with pretty much anything, from the S&P 500 Index to an individual stock like Amazon.com1. Seriously, who would expect any similarities between Bitcoin and Amazon?
At MPI, we breathe data analysis, pattern recognition, time series models, machine learning, which we were a part of pioneering more than 20 years ago, before it became mainstream. Such techniques have proven to be effective in market surveillance, helping to identify cases of fraud and also explain unusual market moves or spectacular fund gains.
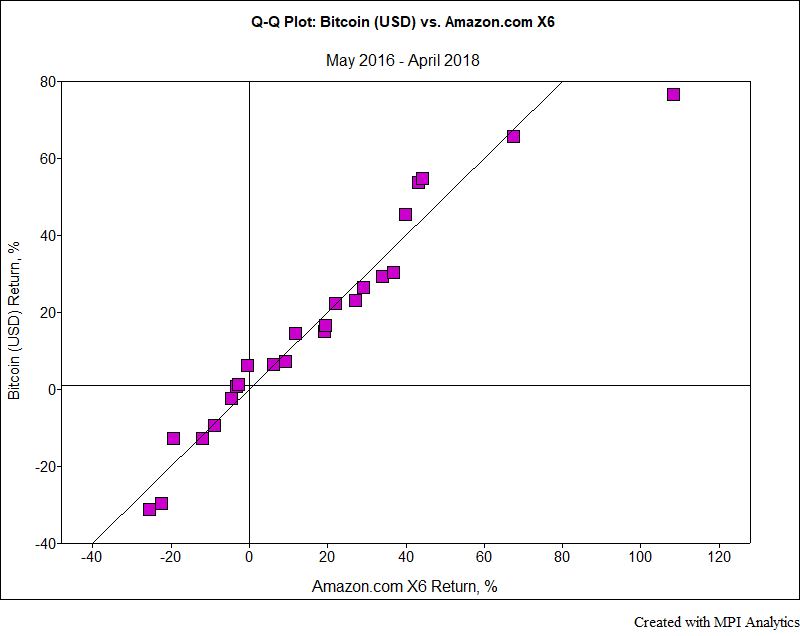
So, we posed the question to ourselves: how might investors have achieved Bitcoin-like returns over the last two years without needing Ambien to stomach the whipsaw swings in price? The chart below provides an amazing insight.
This chart is similar to a Q-Q plot, which is commonly used by statisticians to evaluate similarity between two distributions: each distribution’s observations are grouped into quintile buckets, and average values for each quintile for both distributions are plotted in a scatter plot. A 45-degree line is also plotted, and the closer the observations are to the diagonal line, the more similar the distributions are. Special attention is usually paid to tails, represented by the points on the ends of the line. Our chart, however, is simpler than a typical Q-Q plot, since we’re dealing with a small number of observations (only 24 monthly returns), and there’s no need to group them into quintiles.
First, we multiply each Amazon return by a factor of six, so that it represents approximately a constant 4.5:1 leveraged investment in Amazon2. We then sort Bitcoin returns and Amazon X6 returns separately and align them by the order, so that the largest return of one corresponds to the largest return of the other, the second largest return corresponds to the second largest in the other, and so on.
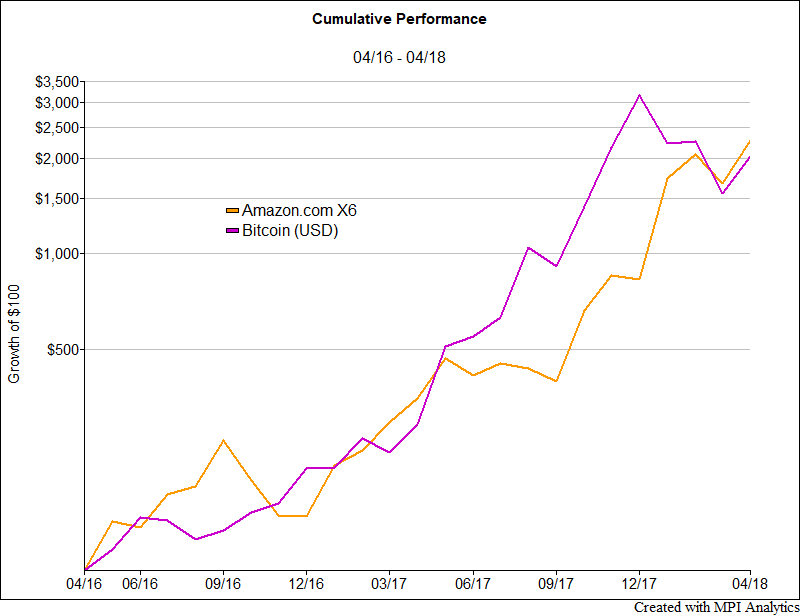
The unexpected result is that pretty much all observations are lined up along the diagonal, indicating that the distributions are almost identical: for every monthly gain or loss for Bitcoin, there was a month of almost the same gain or loss of the levered Amazon stock. This also means, totally unexpectedly, that after 24 months, these two investments produced very similar cumulative gain for investors (2,280% and 2,026% for levered Amazon and Bitcoin, respectively). This is verified in the cumulative growth plot below:
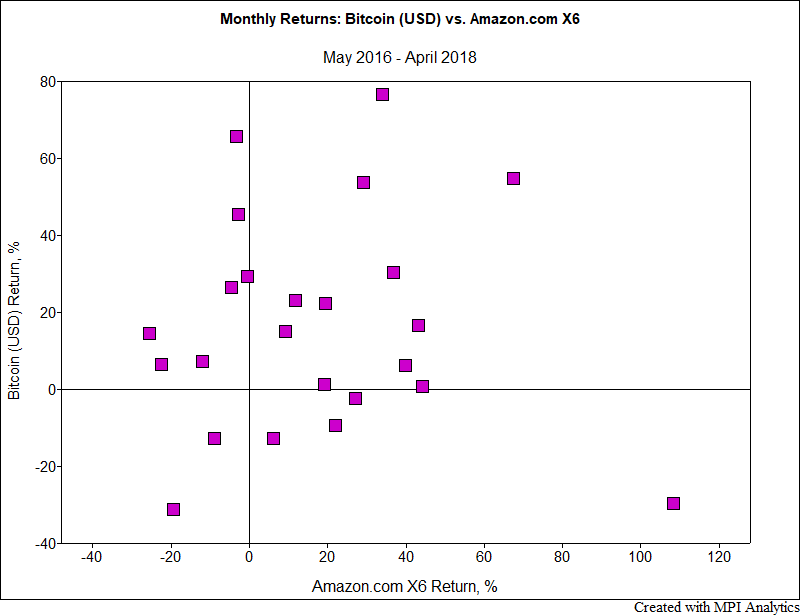
It’s worth noting that these almost identical gains (or losses) happen at different times for both investments, hence, their correlation is zero. This is illustrated in the scatter plot of monthly returns below, where each observation’s coordinate represents monthly returns for the two investments. Monthly gains and losses seem totally unrelated. Moreover, the second worst month for Bitcoin (29.5% loss in January) coincided with the best month for Amazon X6 (gain of 108%).
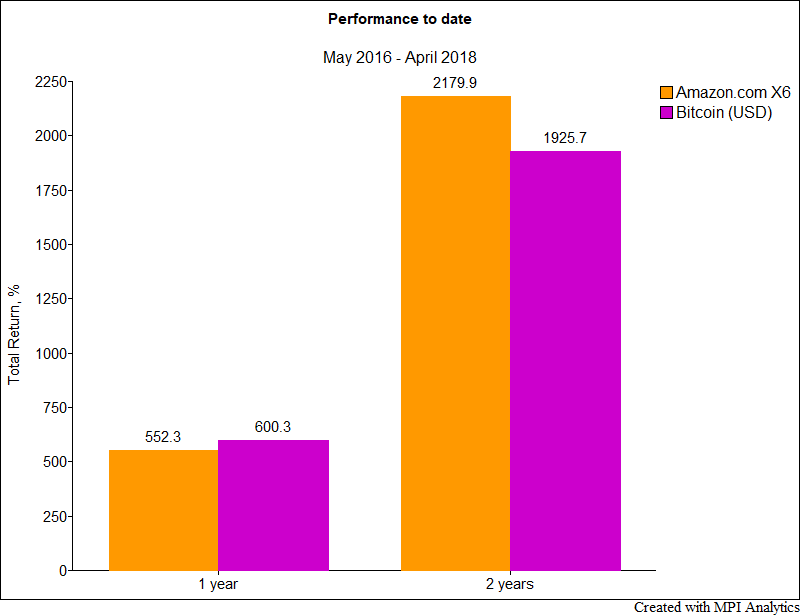
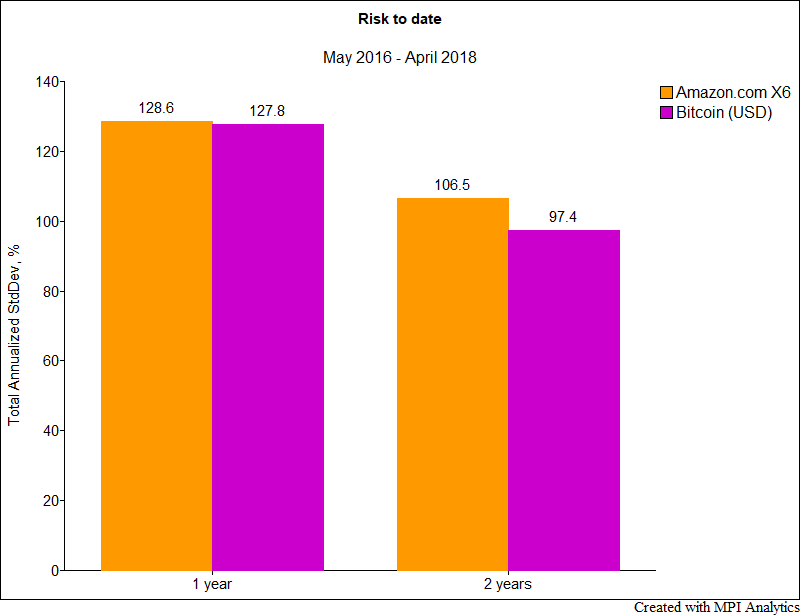
The Q-Q plot indicates that distribution shapes for both investments are very similar, so it’s not surprising to see that their first two distribution moments match, as shown in the charts below. What is surprising though, and totally unexpected, is that performance and standard deviation numbers match in both the trailing 12-month and 24-month intervals.
We certainly are not advising anyone to drop their investments in cryptocurrencies—whether individual or VC—and start leveraging their bets on stocks. We just used this example as an illustration of what kind of problems can be solved with clever math. More specifically, to identify how one can find crypto-like returns in the equity market. For any adrenaline-generating activity, whether it be rock climbing or investing, there’s always a less stressful alternative—one just has to look for it.
Correction: the previous version stated incorrectly that we multiplied Amazon returns by 6 while we actually used 4.5 factor to match Bitcoin’s volatility.
Footnotes
- 1We measured correlations using 24 monthly observations through April 2018.
- 2We don’t take into consideration borrowing costs, and we don’t assume any rebalancing costs which should be relatively small.
